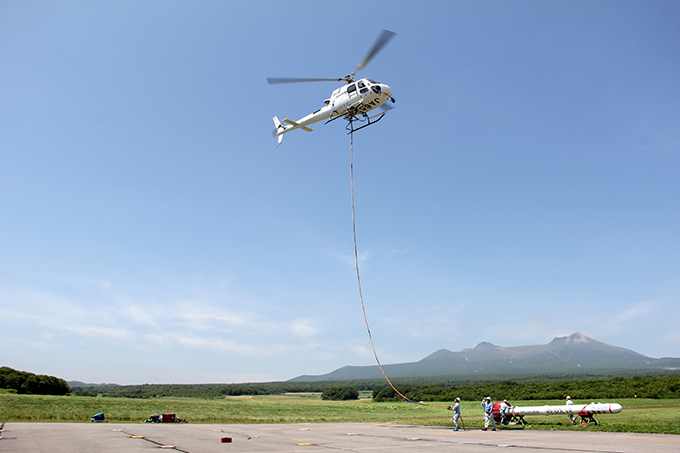
Geological Surveys Based on AEM (Airborne Electro-Magnetics)
Airborne Electro-Magnetics allow 3 dimensional measurement and interpretation of subsurface structure by measuring subsurface resistivity and distribution.
AEM method is being utilized as a efficient technique for geological survey, landslide survey, and various kinds of route study in extensive region or hard access area of mountainous region.
- You can watch a video of a measurement flight in progress.
-
Example of use
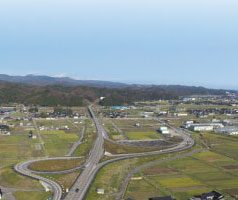
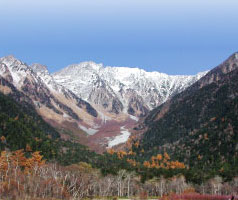
Road Route Selection Survey
- Reducing costs by avoiding interior ground and selecting the best route.
-
We can reduce costs for road construction, maintenance and management by helping select the optimal route. Analyzing unsuitable ground distribution and finding a route over the best surface can be done during the initial stages of the road project, such as in the preliminary design stage. What’s more, we can carry out more efficient surveys by narrowing down problems. Comprehensive aerial geophysical survey, with its ability to survey geology over wide areas, is a powerful tool in road route selection surveys.
-
-
This survey was carried out because unsuitable ground (areas of crayification) was one of the main concerns when surveying the project area for selecting a road route. As a result, unsuitable ground can be seen as low resistivity area(warm color), and we can determine that it is widely distributed around route A. Thus route B, which passes over suitable ground, was chosen. Using this survey method to check the ground over a wide area in the early stages of a project allows not only more efficient and economical surveying, but it can reduce costs of road construction, maintenance and management.
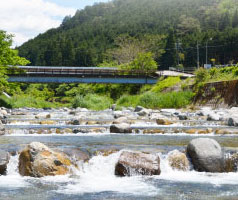
Landslide Survey
-
Cutting costs by drafting more efficient countermeasures with accurate grasp of landslide location and scope!
- Checking the interior condition of slopes is vital when surveying for landslides. If you can identify the primary cause of instability within slopes, you can make more efficient surveys and countermeasures. Comprehensive aerial geophysical surveying can be a huge help in this kind of surveying. It is particularly effective with soft clay ground, thus helping identify latent instability in slopes and so offering vital ground information for slope management.
-
Landslides Survey Example: (Akita Prefecture: Sumikawa Landslide)
- In the Sumikawa landslide and surrounding areas, determined to be caused by widespread clayification as a result of water warming (hot springs), low resistivity readings (less than 10Ω-m) showed the existence of unstable slopes. Later, landslides occurred on slopes A and B, verifying the instability found through the survey. What’s more, the depth of earth that slid in the Sumikawa landslide as measured by resistivity analysis corresponded closely to that measured by boring, confirming the effectiveness of this test as a measure of slope internal conditions.
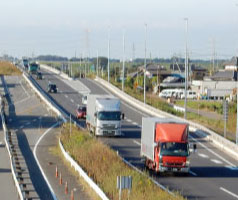
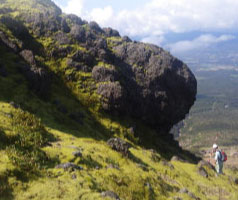
Road Disaster Prevention Inspection
-
We can implement efficient O&M for roads through use of a Geologic Database containing information on the surrounding soil and through structural change surveys.
- We can implement efficient O&M for roads through use of a Geologic Database containing information on the surrounding soil and through structural change surveys. By identifying areas of poor ground all along the route, comprehensive aerial geophysical surveying can be extremely effective use of geologic databases.
-
Example of Road Disaster Prevention Surveying
- Mudflow deposits and areas of tuff show up as low resistivity spots (warm colors). Based on resistivity, there is a huge level of clayification and we can determine this area is unstable and likely to cause landslides. In fact, reports show there is a very large distribution of low resistivity areas along national highways.
The cross-section view shows an example of a landslide at the Yudonosan Ski Slope predicted by analyzed low-resistivity, which was caused by snowmelt. The thickness of the landslide as predicted by resistivity analysis, with the difference between moving earth and stable rock, corresponded closely to that measured by boring. This confirms the effectiveness of this survey.
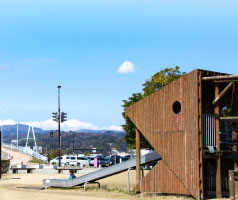
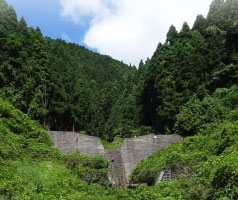
Dam Geological Survey
-
Optimizing overall plan by thoroughly understanding the geological conditions around dam sites or reservoirs
- Comprehensive airborne geophysical survey, with its ability to perform precise surveys over a wide area at low cost and rapidly, is perfectly suited to geological surveys for dam building due to the large area impacted. It can visually capture the entire area connected to the dam, survey landslide areas around the reservoir focused on the dam, and be of great use in quarry site and in selecting relocated road.
-
Example of Survey in Dam Project Area
- Survey showed that areas of low resistivity is distributed along the river bed, and high resistivity is distributed on the left and right banks. These results corresponded closely to the ground conditions found by boring survey. Therefore, it can be stated that this method is well suited to checking ground conditions.
A high degree of precision is desired when surveying the exact amounts of aggregate resources in quarries. Since vertical electric survey can be strongly affected by topography, correct understanding of ground conditions may be difficult, such as apprearance of wrong images in the results. (images below) . However, this survey is unaffected by topography, and since it offers accurate 3 dimensional surveying of ground conditions, is a very effective survey technology.
Ground Water Contamination Survey
-
Specify the polluted area by distribution of ground water at the illegal industrial waste dumping sites
- In terms of countermeasure for ground water pollution, it is necessary to define the polluted area as well as identification of the pollutants. In areas where large levels of electrolytes accompany the pollution, comprehensive airborne geophysical survey can be so effective in establishing the scope of the polluted zone in 3D by finding resistivity abnormalities.
-
Example of illegal Industrial Waste Dumping Site Survey
- In this example of using this survey in an illegal industrial waste dumping site, the waste itself displayed low resistivity, thus the contaminated groundwater showed a wide distribution. The area shown in cross section with low resistivity (colored red) corresponds to the presumed illegal dumping site. The resistivity data allowed us to determine that the contaminated area was larger than had been expected.
Due to varied composition not all waste matter itself has low resistivity, but since the contaminated water displays lowered resistivity it is possible to accurately determine its range of distribution.


 was one of the main concerns when surveying the project area for selecting a road route.")


